
BOULDER QA’S UPDATED 2021 RECOMMENDED BROWSER / DEVICE LIST
We are nearly half way through 2021 we wanted to provide an update to Boulder QA & Consulting Inc’s recommended Browser / Device set for QA of Responsive Websites and Applications for 2021 based on statistics obtained from GlobalStats statcounter (https://gs.statcounter.com/).
We send our partners recommendations for Browsers and Devices based on Browser and Device statistics. If our partners do not have access to website or application usage analytics or defined browser/device specifications, then they use this data when sizing new projects for development and QA.
With technology constantly changing with new operating systems, faster hardware and better screen resolutions it is challenge for us as technologists and our business partners to keep up with the latest trends and new hardware on the scene. We regularly check statistics to make sure that we are reviewing sites and applications using the best information available.
We also wanted to share what devices that we have physically in our QA Lab as well as how we address devices that we may not have physical devices for.
What browsers and devices are we recommending for 2021 and how do we come up with the recommendations for the coming year? This post is broken down into 3 sections:
2021 Recommended Browser / Device List
The following outlines BQA’s recommended Browser / Device List for 2021 (UPDATED) based on the statistics we have obtained from Global Stats statcounter (https://gs.statcounter.com).
Browsers
- Chrome: latest version available
- Safari: latest version available
- Firefox: latest version available
- Edge (Chromium) on Windows 10: latest version available
NOTE: Microsoft End of life dates for IE11 and Edge Legacy are as follows:
- IE11: August 17, 2021
- Edge Legacy: March 9, 2021
https://docs.microsoft.com/en-us/lifecycle/announcements/m365-ie11-microsoft-edge-legacy
Android Devices
- Samsung S10 / OS 11
- Google Pixel / OS 10
- Google Pixel 3 / OS 9 (As Required)
iOS Devices
- iPhone 12 / iOS 14
- iPhone XS / IOS 13 (As Required)
- iPhone 8 / iOS 14
- iPhone Mini / iOS 14
- iPad Pro 10.5 / iOS 14
NOTE: Based on the latest statistics, iOS 14 is currently has a 87% Market Share through May 2021. We will also have the ability to review iOS 15 Public Beta starting in July using Xcode simulator as required.
Usage Statistics
Boulder QA has reviewed a number of sites that provide market share statistics across platforms and operating systems. We really like the flexibility of Global Stats statcounter (https://gs.statcounter.com). Global Stats calculate their statistics on the basis of more than 10 billion page views per month by people from all over the world onto their 2 million+ member sites. Global Stats allows the user to review the market share on a worldwide basis or narrow it down to a specific market region, for example the United States
With a majority of the Boulder QA partners and users located in the United States we are able to view this specific region and provide a recommendation to our clients on which browsers and devices will provide them with the best coverage for the website or application. When we have a client outside of the United States, we can quickly adjust our inputs to their region and make recommendations with statistics to support their specific audience.
The following are the statistics BQA used to support our recommendations for 2021 (UPDATED).
Desktop Browser Market Share
United States for the Last 6 months (Dec 2020 – May 2021)
| Chrome | Safari | Edge | Firefox | IE |
| 61.05% | 17.49% | 11.01% | 5.9% | 2.05% |
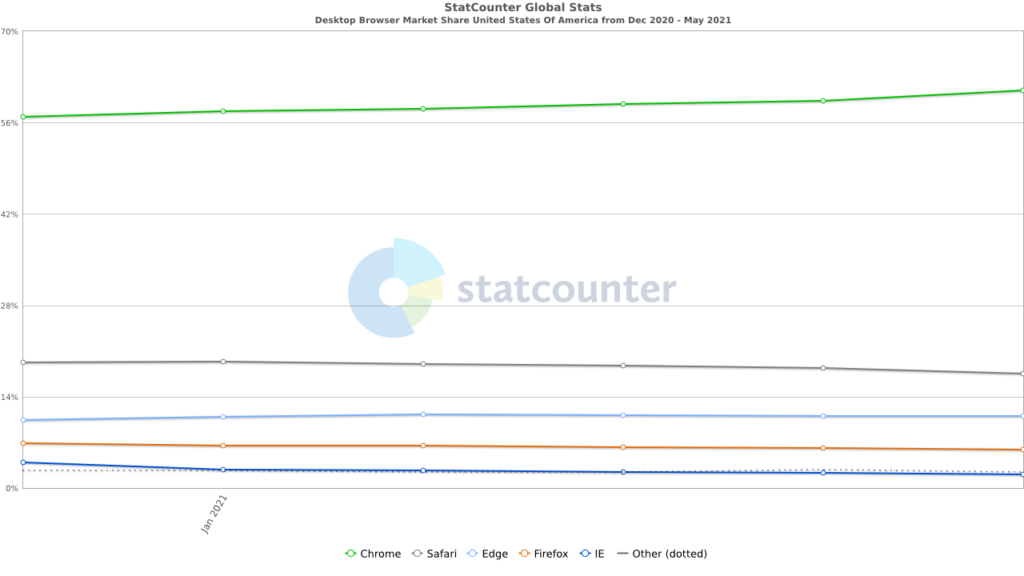
Source: StatCounter Global Stats – Browser Market Share
iOS Version Market Share
United States for the Last 6 months (Dec 2020 – May 2021)
| iOS 14.4 | iOS 14.5 | iOS 14.2 | iOS 12.5 | iOS 14.3 | iOS 13.6 |
| 68.55% | 12.94% | 2.92% | 2.49% | 2.21% | 1.02% |
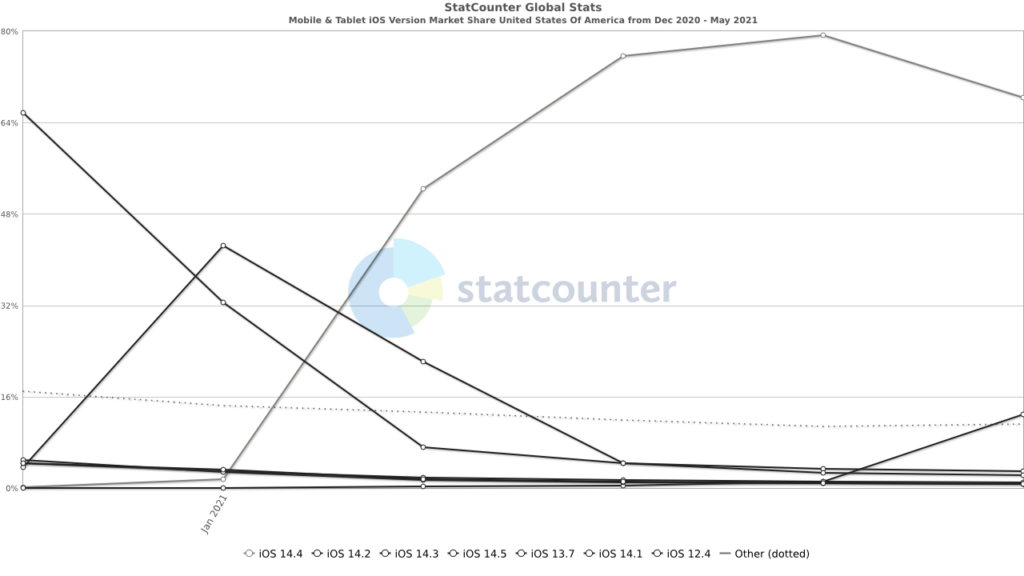
Source: StatCounter Global Stats – iOS Version Market Share
Android Version Market Share
United States for the Last 6 months (Dec 2020 – May 2021)
| 10.0 | 11.0 | 9.0 Pie | 7.0 Nougat | 8.1 Oreo | 8.0 Oreo |
| 30.72% | 29.9% | 18.98% | 4.55% | 4.46% | 4.15% |
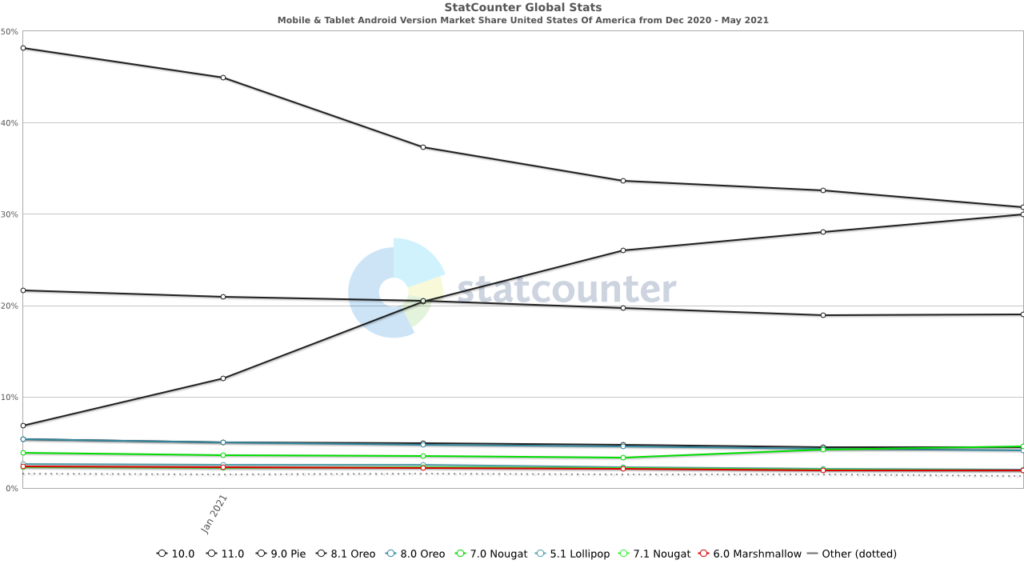
Source: StatCounter Global Stats – Android Version Market Share
Boulder QA Test Lab
The following is a list of physical devices that BQA currently has in their lab. We also use BrowserStack (https://www.browserstack.com) to supplement the physical devices that we have in inventory. BrowserStack provides BQA the ability to review websites on devices that we may not currently have in our Test Lab or if a client has a very specific device that they would like reviewed.
While we believe the best review of any website or application is on a physical device, we have found that BrowserStack provides us the ability to expand our lab with confidence for specific client requests that may occur outside of physical devices that we currently have outside of our lab.
We have also used BrowserStack to help identify issues which may always be repeatable within our client’s development environment. There have been cases where we have reported an issue to our development partners that they cannot reproduce in house. Using BrowserStack to verify the issue and allowing us to share those results with our development partners increases the ability to provide a quality product to the end users.
Desktops
- MacBook Pro
- Windows 10 (Physical and Virtual Machines)
- Windows 7 (Virtual Machines)
iOS Devices
- iPhone 12 Pro / iOS 14
- iPhone 12 / iOS 14
- iPhone 12 Mini / iOS 14
- iPhone Xs / iOS 13
- iPhone X / iOS 14
- iPhone X / iOS 13
- iPhone 8 / iOS 14
- iPhone 7P / iOS 14
- iPhone 7 / iOS 13
- iPad (2018) / iOS 14
- iPad Pro 10.5 / iOS 14
- iPad Mini 4 / iOS 14
Android Devices
- Samsung S10 / OS 11
- Pixel / OS 10
- Pixel 3 / OS 9
Recent Comments